Indoor Climate Research and Training (ICRT)
SmartLogic and Indoor Climate Research and Training (ICRT) partnered to develop an indoor air quality monitoring platform that delivers real-time alerts to residents, structures sensor data for researchers, and empowers healthier communities.
A shortcoming of commercially available indoor air quality monitors is that they indicate problems, but not solutions. This gap leaves many potential users finding a lack of value in something that could theoretically have substantial benefits on their well-being.
SmartLogic and Indoor Climate Research and Training (ICRT) developed a data platform that connects home air quality sensors to both residents and researchers. Home evaluation specialists install monitors that detect changes in common indoor pollutants. When a threshold is reached or exceeded, the system automatically sends alerts to residents with clear recommendations, such as opening windows or turning on an exhaust fan.
The platform empowers both residents and researchers, going beyond immediate safety to record and structure sensor data for long-term analysis.
- Built a custom system that integrates IoT air quality sensors with a dynamic data pipeline.
- Leveraged Elixir, Prometheus, Grafana, PostgreSQL, Twilio, and Mailgun for scalable data ingestion, visualization, and real-time alerts.
- Designed interfaces to meet the distinct needs of residents, healthy home evaluators, and researchers.
- Gathered community input to inform the dashboard design and build a platform that reflects real resident needs.
Project Goals
ICRT’s mission is to “bridge the gaps between energy and health, and between research and practice to improve real outcomes for residents.” As part of the Champaign County Regional Planning Commission (CCRPC), ICRT is nationally recognized for its leadership in residential building science.
To fulfill this mission, ICRT trains state weatherization workers, conducts research at the intersection of energy efficiency and indoor air quality, and translates findings into practices that improve the health and safety of households across Illinois.
The IAQ monitoring initiative, developed in collaboration with SmartLogic, extends that mission by creating a state-of-the-art platform that both organizes and analyzes data while communicating directly with participants. Specifically, ICRT set out with two ambitious goals:
- Protect residents in real time by sending timely, actionable alerts when indoor pollutants spike. This moves from problem identification to providing solutions, a key need for residents to make meaningful use of indoor air quality monitoring technology.
- Advance scientific understanding by collecting detailed data on how often contaminants occur, how people respond to alerts, and whether providing this information results in improved indoor air quality.
At its heart, the mission is both simple and powerful: give families the tools and knowledge they need to breathe safely in their own homes.
Technical Collaboration
ICRT has in-house expertise with Python, AWS, and hardware integration. For this project, they sought to partner with a custom software development team that could connect their current technology and build complex, user-facing software with multiple dashboards that seamlessly integrate all components and can be used by both researchers and residents.
The system had unique requirements:
- Register and manage unique profiles for homes, sensors, and recording sessions.
- Collect and format streaming data from sensors for storage and analysis.
- Create graphs and visualizations of results for researchers and residents.
- Trigger real-time alerts based on sensor readings and send them to users via text and email.
- Access level controls for managing sessions between researchers and evaluators.
From Sensor to Software: How It Works
The system is built on a robust architecture that integrates hardware, data collection, visualization, and alerting. Here’s a breakdown of how it all comes together:
The Hardware
The process starts inside the home, where home performance professionals install air quality sensors from a range of manufacturers. These sensors detect common household air pollutants like particulate matter (PM2.5) and carbon dioxide (CO₂).
Next, the sensors send the live data of their readings to a connector, which translates the raw data from the device so it can be analyzed and processed by the larger system.
After data normalization to a standard format, including the addition of UTC timestamps, all information from participating households and devices can be graphed and observed.
For added resilience, the system includes fail-safe measures to prevent data loss in the event of connection drops.
Collecting the Data
Once the readings are standardized, the data is uploaded to a Prometheus server designed to collect time-series data (in this case, sensor readings every 60 seconds). Prometheus continuously scrapes the data from each registered home and records it in a structured way.
Simultaneously, PostgreSQL manages the system’s metadata, which includes additional details about the home, sensor, recording session, and alert rules. This database allows researchers to track which data belongs to which household.
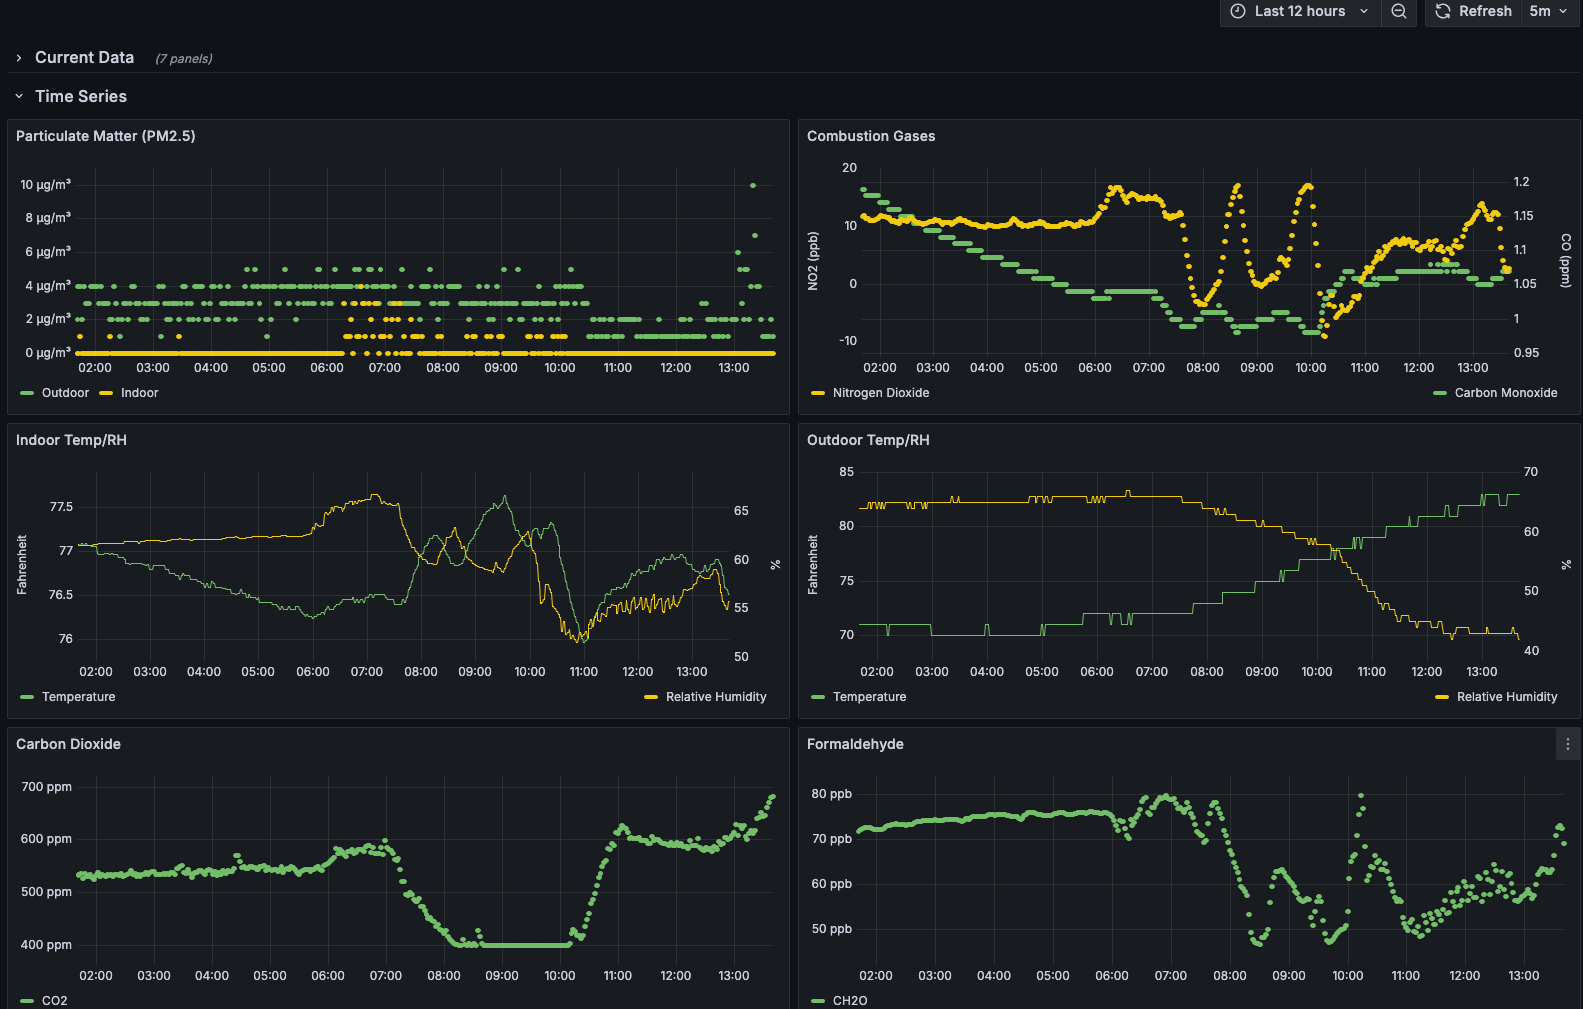
Visualizing the Data
With clean datasets flowing into Prometheus, researchers can view the results via Grafana dashboards. Grafana provides clear graphs and charts that make it easier to notice patterns. These dashboards simplify the analysis of long-term trends, allowing administrators to quickly monitor system health and performance across participating homes.
Real-Time Alerts
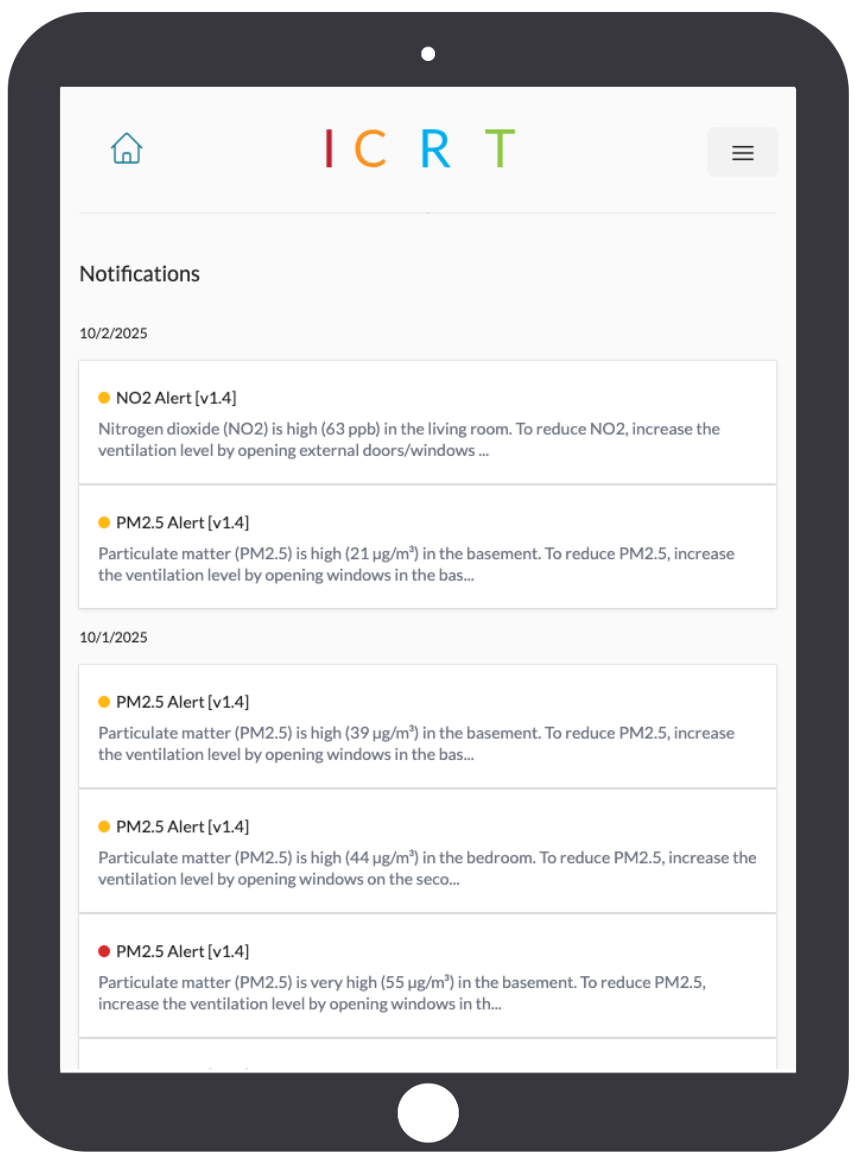
Beyond data collection, the system protects families. Grafana Alerting continuously checks sensor readings against the thresholds for safe in-home levels. When it detects levels above the safe limit, it sends a signal back to the main application.
When the system receives this signal, it triggers Twilio and/or Mailgun to send a text or email alert directly to the resident of the home with the elevated reading. The message notifies the resident of which pollutants are at high levels and suggests actions they can take to reduce the levels. For example, the text message might read: “PM2.5 levels in your home are high. Please turn on the exhaust fan in your kitchen.”
All alerts are also logged in the database, allowing researchers to determine whether message alerts correlate with improvements in air quality.
Portals for Residents & Researchers
The system requires two different interfaces, as it serves two different user types:
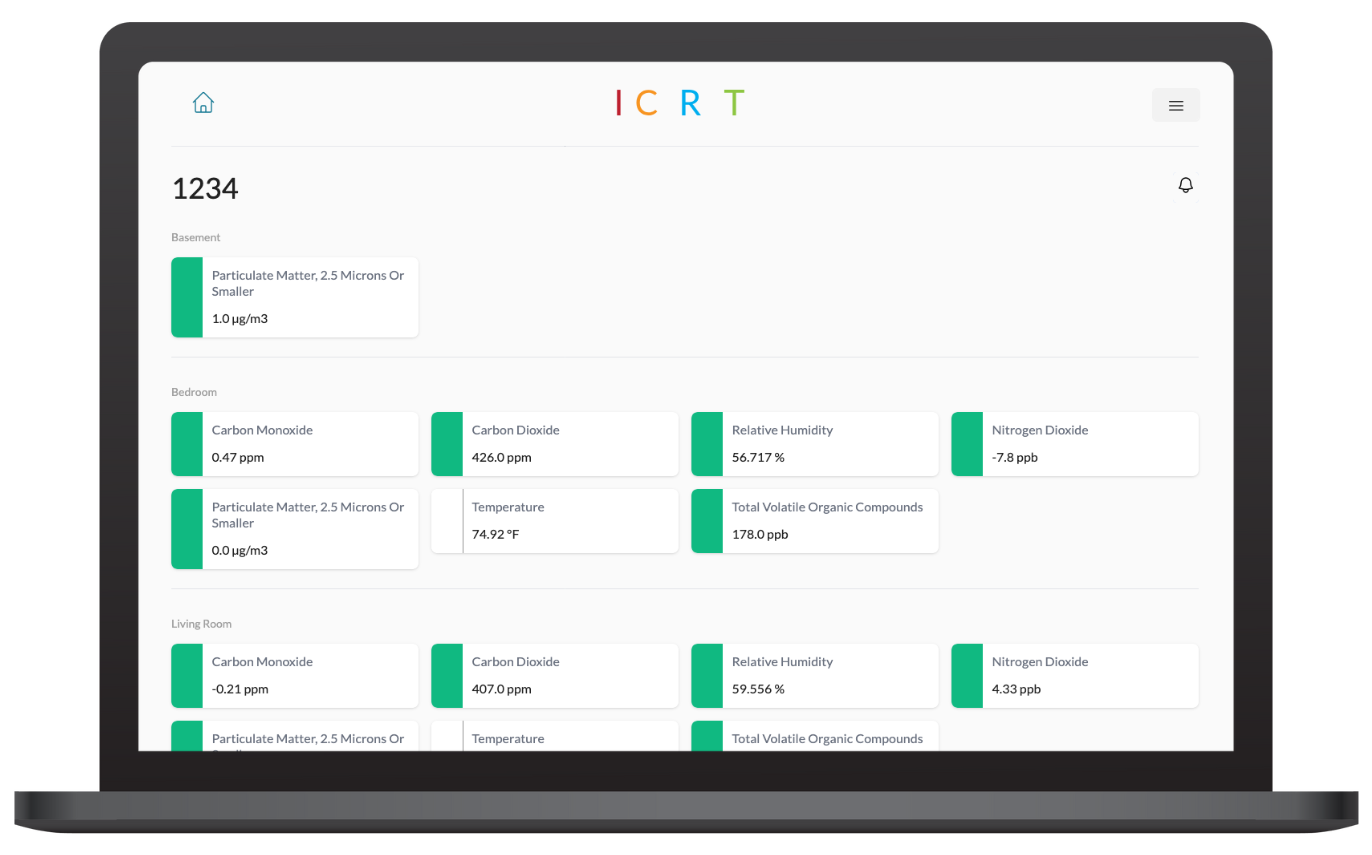
The Resident Portal
Families log in to a dashboard that displays comprehensible information about their home’s air quality, including simple graphs that illustrate changes in pollutants over time, trends, and suggested actions for improvement.
The Admin/Researcher Portal
Healthy home evaluators access a separate dashboard that allows them to register new homes, configure hubs and sensors, and start/stop new recording sessions. Researchers use this data for broader studies of air quality values, participant behaviors, and outcomes.
Collaboration & Co-Design
- Tight technical collaboration: ICRT provided protocols, demo scripts, and field context; SmartLogic turned them into production-ready services and UIs.
- Researchers now have structured, reliable data that will enable them to study pollutant trends and the effectiveness of interventions at scale.
- A foundation for future impact: By combining real-time alerts with long-term data collection, the platform positions ICRT to demonstrate measurable improvements in air quality and resident health as the program expands.
Paul Francisco, Director of the Indoor Climate Research & Training (ICRT) Program, reflected on the partnership:
“SmartLogic really listened to what we needed and brainstormed to provide a solution to those needs. They were very thoughtful to bring us to the place we were trying to go. That service approach was more personal.”
Challenges & Solutions
- Different Sensor Types: Participating residences are equipped with various sensors, and their APIs differ from one another. To overcome this challenge, we standardized ingestion and implemented Prometheus’ scrape model with dynamic configuration, ensuring a clean and scalable integration.
- Beyond Observability: We repurposed Prometheus, a DevOps staple, for data ingestion from an IoT environmental monitoring system that stores time-series data at a 60-second cadence, enabling efficient queries and triggering native alerts.
- In-Depth, Reliable Reporting: The system not only tracks sensor readings in real-time but also ensures that no data is lost or misaligned. If the internet service drops, the connectors temporarily store readings locally and forward them once the connection is restored.
- Simple and User-Friendly Experience: The dashboard displays clear trends and straightforward actions to take when air quality levels drop, as well as previous issues that have occurred. For evaluators, the setup process is streamlined, allowing them to register homes and sensors quickly and minimizing time and complexity during on-site visits.
Outcome
The platform is still in its early days, but ICRT has already begun deploying dashboards for residents to view and interact with their air quality data. Communities in Chicago suburbs have shown strong enthusiasm, with residents and local leaders also expressing their support.
While it is too soon to measure long-term health outcomes, the project has already created value:
“We have a positive outcome just in having the people in these communities feel like someone has been listening to their needs. A positive relationship with these communities is nothing to take for granted.” - Paul Francisco, Director of ICRT